
Table of Contents
Data is kind of like the foundation for making smart decisions and doing solid research. It comes in all shapes and sizes and gives us valuable insight into how things are going in the world. One type, called cross-sectional data, is like taking a snapshot, it shows what’s happening at one particular moment in time.
These days, with so much information coming from everywhere, having the right tools to understand it all is more important than ever. Cross-sectional data is one of those tools. For example, if you run a survey to find out what people in a neighborhood are earning right now, that’s cross-sectional data, it captures the current picture.
This blog, ideated and written by an expert at allassignmenthelp will be shedding light on various aspects of cross-sectional data.
What is Cross Sectional Data?
Cross-sectional data is collected by taking a sample of people, things, or groups at one specific point in time. It gives you a kind of “snapshot” that shows what’s going on in a population or sample at that exact moment.
Such data is frequently used to study and analyze diverse occurrences in a variety of sectors, including public health, economics, sociology, and market research. In courses like statistics, cross-sectional data plays a crucial role.
Read more: Descriptive and Inferential Statistics
Example of Cross Sectional Data
To have a clear understanding, we have to take a look at the cross sectional data example.
Take a look at below:
Examples of Cross-Sectional Data
Blood Pressure Study
- You want to measure current blood pressure levels in a population.
- A random sample of 1,000 people is selected from that population (a “cross-section”).
- Their blood pressure, along with height, weight, and other health factors, is recorded.
- This data provides a snapshot of blood pressure levels at that moment.
- It shows the current proportion of high or low blood pressure, but doesn’t reveal trends over time.
- While it doesn’t indicate if blood pressure rates are rising or falling, it gives a good picture of the current situation.
Ice Cream Flavor Study
- A study looks at how people respond to different ice cream flavors at a specific store.
- The data reflects preferences at that particular point in time.
- Student Grades Example
- A list of grades from a single test taken by a class of students is another example.
- It captures student performance at one specific moment.
Coffee Shop Sales Snapshot
- Data is collected on sales revenue, sales volume, expenses, and customer count for the last month.
- This reflects the shop’s performance during that one month—making it cross-sectional data.
- If you tracked daily sales and expenses over several months, it would become time series data, which shows patterns or trends over time.
Have you ever experienced collecting such data took a lot of time and directly hampered your preparation for an upcoming online exam? If your answer is yes, typing Take my online exam can do a miracle! Once you search this query on the internet, so get many online class help sites offering online exam assistance at any time of the day. If you have an exam online and have very little time for preparation, opting for such services can be very helpful in securing high grades.
Characteristics of Cross-Sectional Data
Comprehending the attributes of cross-sectional data is required for proficient analysis and interpretation.
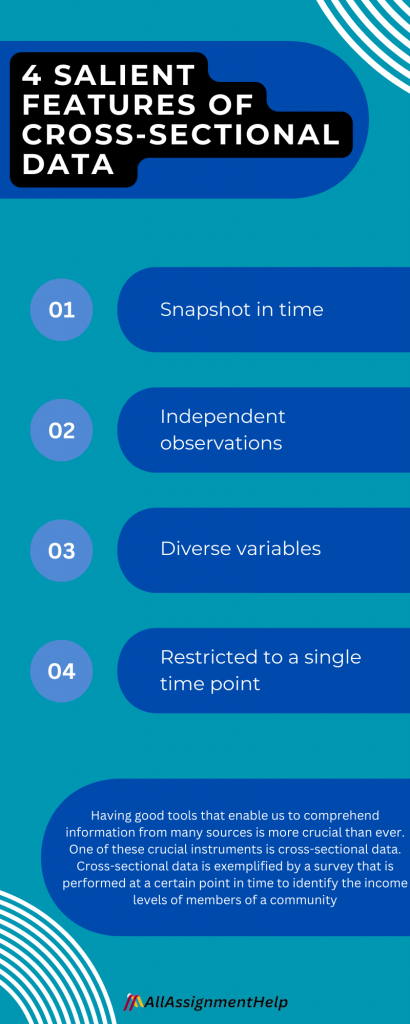
The following are the salient features of cross-sectional data:
- Snapshot in time: Providing a brief period of time’s worth of information without monitoring changes or advancements throughout time is a fundamental feature of cross-sectional data.
- Independent observations: In a cross-sectional dataset, every data point corresponds to an independent observation. Every household’s revenue is recorded separately from the rest in our example of household income.
- Diverse variables: Because it may cover a wide range of variables, it can be applied to a variety of research problems. These factors can be continuous (like age or income) or categorical (like gender or educational attainment).
- Restricted to a single time point: It is significant to highlight that this data is unique from other forms of data, like time series or panel data, in that it is only collected once.
If you are studying statistics, this is a sub-topic that you have to go through and prepare. But for many, this subject becomes a nightmare. Analyzing huge amounts of data may not be easy for everyone, and while executing such academic research, many end up searching online can someone do my online statistics class for me. You might be surprised to know that such wishes of the majority of the students in the field of statistics is being fulfilled. There are many online class help sites offering online class help to students who are facing difficulties in managing their study responsibilities, making it easy for them.
Cross Sectional Data vs. Time Series Data
Data comes in various sizes and shapes. This data measures many things at different times. Well, both cross-sectional data and time-series data are of specific interest to financial analysts. Various methods are used to analyze different types of data. It is, therefore, crucial to be able to identify both time series and cross sectional data sets.
Let’s discuss both and get to know cross-sectional data vs time-series data better:
Cross sectional Data
These observations are collected from various groups or individuals at a single point in time. To ensure meaningful analysis, the population should consist of members with similar characteristics.
For example, if you want to understand how much companies invest in research and development, the results may vary significantly some companies spend very little, while others invest heavily. This variation arises because the companies may belong to different categories or industries.
To make the analysis more consistent, it’s better to group similar companies together and then perform a cross-sectional analysis within that group.
Now, let’s move on to Time-series data.
Time-Series Data
These are observations that are collected at equally spaced time intervals. For example, you can consider the daily closing price of a particular stock recorded over the past four weeks. One thing is to be noted, and that is, that a too short or too long time can lead to time bias.
Other examples of Time series data can be, the weekly sales graph of an ice cream sold during a holiday period at some shop. Another example can be, staff numbers noted at a college, which was taken monthly. It was done to assess the turnover rates of the staff. These examples can be used to showcase data patterns shortly.
Students mostly find it highly challenging to sort assignments related to this topic. If you are among those and thinking Is there anyone to take my online class so that I can focus better on finishing my assignment related to cross-sectional data vs time-series, service is available all over the globe to support students manage their study load and do better in their higher education.
Also, if you think that doing such an assignment is way out of your expertise, getting assistance from a professional statistics assignment help online service will be the smartest idea.
Read more: Top 8 free statistics software for 2024
Importance of Cross Sectional Data in Research
Cross-sectional data is super important for researchers and analysts in different areas. It’s like a helpful tool that comes with many advantages.
Let’s learn the importance of cross-sectional data in research:
Recognizing diverse groups
It enables you to research and contrast various groups or people at the same time. When trying to comprehend the traits, customs, or inclinations of various populations, this is essential.
Comparing the health status of individuals from different age groups, regions, or backgrounds is beneficial in the healthcare industry, for instance.
Finding inequalities
It facilitates the discovery of differences or inequities. You can identify differences in variables such as income, education, or health by simultaneously gathering data from several groups. This is crucial for figuring out where social or economic disparities are and whether any measures are necessary.
Allocation of resources
This data is used by corporations, organizations, and governments to make well-informed resource allocation decisions.
For example, based on the requirements of various locations or towns, it helps determine where new schools, hospitals, or infrastructure should be built.
Market analysis
This information is utilized in business and marketing to comprehend product demand, market trends, and consumer preferences. Businesses are able to decide on product development and marketing strategies by gathering data from different client segments at a particular time.
Public affairs
This information is used by policymakers to create efficient public policies. To create policies that specifically address demands and issues, they might conduct analyses of the current conditions of various people and locations.
It can help with judgments about social assistance programs, minimum wage rules, and environmental regulations.
Comparing and contrasting
Setting objectives and benchmarks with it is beneficial. It offers a starting point for tracking advancement over time. You can evaluate the success of policies, interventions, or programs by comparing data from various years.
Research at a low cost
Compared to longitudinal studies, which track the same people or groups over time, cross-sectional data collection is frequently speedier and less expensive. Because of this, it is a desirable choice for institutions and researchers with tight budgets.
We can see how crucial it is. The use and importance of cross sectional data is vast and almost every organization can be benefitted from it. If you are trying to learn in-depth about cross sectional data but not getting enough time for your coursework, instead of hesitation, avail of an assignment help service for all your statistics coursework-related needs. At an affordable cost, you can get help from highly educated and experienced statistics professionals to gain no less than an A in your papers.
Application of Cross-Sectional Data in Various Fields
This data is versatile and finds several important uses across various fields.
Let’s dive deeper into it to know the applications of cross-sectional data:
- Snapshot Analysis: Cross-sectional data captures a single moment in time across multiple groups, allowing for the comparison of specific attributes. In medicine, for instance, it helps analyze the prevalence of different diseases across age groups at a given point in time.
- Economic Studies: Economists use cross-sectional data to study variables like market demand, employment rates, and income distribution across regions or demographics, aiding in the development of informed economic policies.
- Social Science Research: Sociologists and social scientists rely on this data to explore social behaviors, patterns, and inequalities, offering valuable insights into the dynamics within communities.
- Market Research: In business and marketing, cross-sectional analysis helps identify consumer preferences, product demand, and market trends across different customer segments, enabling companies to tailor products and strategies effectively.
- Education Planning: Educational researchers use this data to evaluate student demographics, academic performance across groups, and how resources are allocated within educational systems.
- Demographic Insights: Understanding population growth, migration trends, and family structures helps urban planners and policymakers make better decisions in social services and resource allocation.
- Business Strategy: Businesses analyze cross-sectional data to track industry trends, segment markets, and understand customer behavior, key elements in making strategic decisions.
- Mastering cross-sectional data analysis is a valuable skill in today’s job market. Employers actively seek candidates who can interpret and apply this data effectively, become proficient, and you’ll open doors to great opportunities.
Merits and Demerits of Cross-Sectional Studies
As everything has its pros and cons, cross sectional data is no exception.
Let us first take a quick look at some of its pros below:
- A cross-sectional data study can be conducted in less time
- All the variables of this study are collected at the same point in time
- Research can be conducted on multiple outcomes at the same time
- It is a good form of data collection for descriptive analysis
- It can help commence new or further research
Now, let’s look at its cons:
- The cross-sectional study cannot be used for timeline-based research
- It could be tough at times to identify the people who come under similar variables
- Associations are tough to analyze
- The study can be biased as well
- It does not help to determine the cause
To do it well, students need to know both pros and cons of cross sectional data. This helps them process such data in a manner that can be useful and fetch results.
Process Associated With Cross Sectional Data Collection
Cross-sectional data differs from other data. Collecting this data involves gathering information from different individuals, groups, or entities at a single point in time.
Following is a step-by-step guide on cross sectional data collection process:
Specify Your Research Goals
Clearly state your objectives for the study, the factors you hope to examine, and the particular data you hope to gather. The entire process of gathering data is guided by knowing the study’s aim.
Select Data Collection Techniques
There are several approaches for gathering such information.
Let’s take a quick look at it:
- Surveys and questionnaires: Draft a list of inquiries to pose to the sample you have chosen. Surveys can be carried out online via forms, over the phone, in person, or by email.
- Observations: Without asking questions, observe and note traits or behaviors. For example, seeing how customers behave in a store.
- Current databases: There are situations when the information you require is already available in databases or records, such as public cross-sectional data sets, government statistics, or census data.
The tool selection
Create precise and straightforward questions if you’re employing a cross-sectional survey or questionnaire. Make sure they don’t confuse the responders and are simple to understand.
When your strategy and equipment are ready, follow the provided steps to get the best result:
- Utilizing the data collecting strategy you have selected, approach your sample of choice and gather information.
- Be kind and explicit, and make sure the responders know why your data is being collected.
- If you are surveying people, give them out and make sure you have them back within a certain time frame.
- When making observations, make a note of the particular traits or actions that catch your attention.
Arrange and complete the data
After gathering the data, appropriately arrange it. Verify that there are no errors, omissions, or contradictions. Put the data into a computer if necessary. Then, evaluate your data and make inferences using a variety of instruments or software. Compile your results, make inferences, and present the data in a report, presentation, or any other format that works for you.
Recall that it’s critical to gather data in an ethical manner and with consideration for the individuals or organizations supplying the information. Make sure you respect their privacy and use the information for the intended purpose in a responsible manner.
Read more: 100+ Cool Ideas to Nail Your Statistics Project
Conclusion
In the field of data analysis, cross-sectional data is an effective instrument that provides insightful information about particular occurrences at one particular point in time.
Despite its drawbacks, researchers, analysts, and policymakers must comprehend its features and applications. When used effectively, this data can offer a multitude of insights to aid in decision-making and tackle an extensive array of cross-sectional research queries.
Frequently Asked Questions
| Question 1: What is a cross-section symbol? Answer: A cross section is denoted by σ (sigma) and is expressed in units of area, more specifically in barns. |
| Question 2: What is cross-sectional data used for? Answer: Political scientists use cross-sectional data to analyze demography and electoral campaigns. |
| Question 3: Are cross-sectional studies valid? Answer: Cross-sectional studies are most fitting for screening hypotheses. This is because they require a relatively shorter time commitment and fewer resources to conduct. |
| Question: Why is cross-sectional data considered a powerful tool in real-world decision-making? Answer: Cross-sectional data offers instant insights by capturing multiple variables across different groups at a single point in time. This allows researchers, businesses, and policymakers to identify patterns, compare segments, and make data-driven decisions, without waiting for long-term studies. |
| Question: Can cross-sectional data reveal hidden inequalities or market opportunities? Answer: Absolutely. By analysing differences between groups, such as income levels, customer behavior, or access to services, cross-sectional data can uncover disparities or untapped segments that may otherwise go unnoticed, offering a strategic advantage in social planning or business growth. |